

by Lucas Buckwell, Junhao Chen, Maggie Holyoke, and Sydney Merrill
Developed with Brown University's Duane Lab, Harmonic Interfaces translates numerical data into music that carries a deliberate emotional character. The project combined research into musical emotion, an exploratory audio-classification model, a listener-response survey, and computational sonification to render a single dataset five ways: happy, sad, tender, angry, and fearful.
Lucas Buckwell led the literature synthesis, survey design and statistical analysis, and MATLAB signal-analysis work.
One dataset, five interpretations
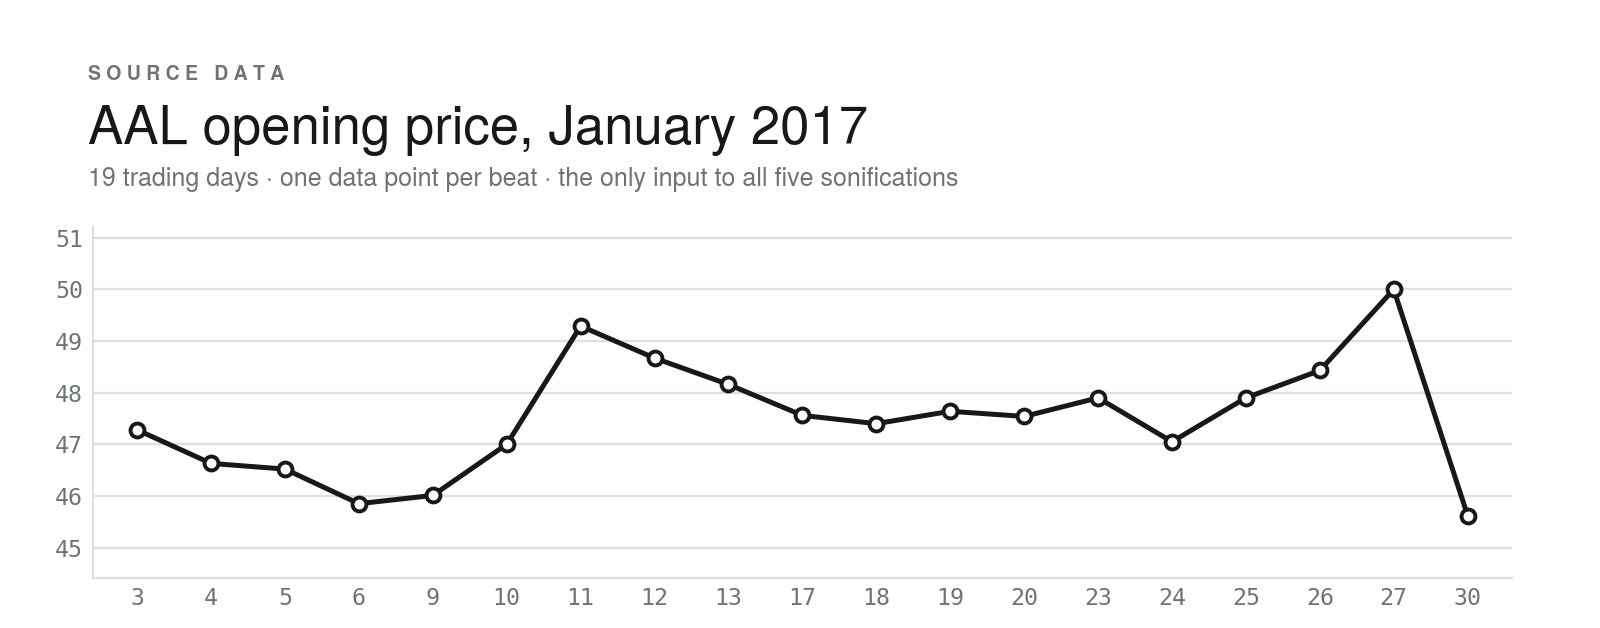
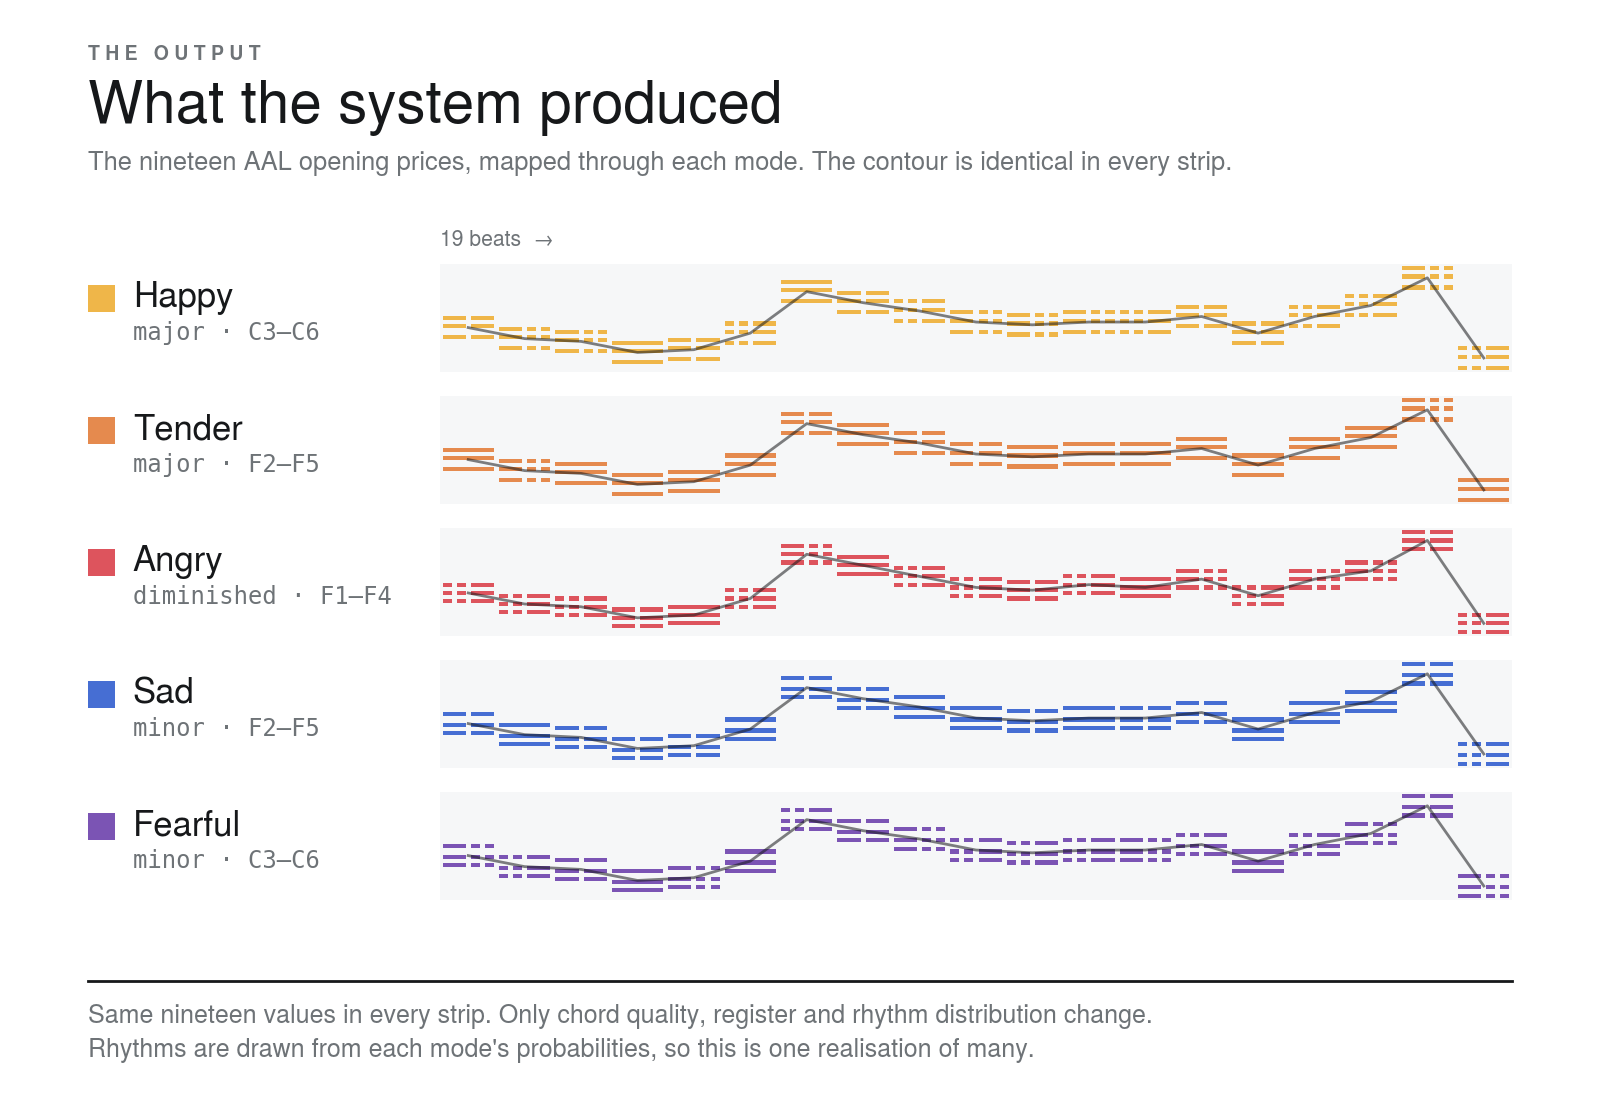
Every clip encodes the same series: the daily opening price of the AAL ticker across January 2017. The numbers never change. What changes is chord quality, register, and rhythm.
Designing sound to be felt,
Data is almost always something you look at. The Duane Lab wanted to study what happens when you engage other senses instead. Our question was narrower: can sound generated from a dataset carry not just the shape of that data, but a chosen emotional character?
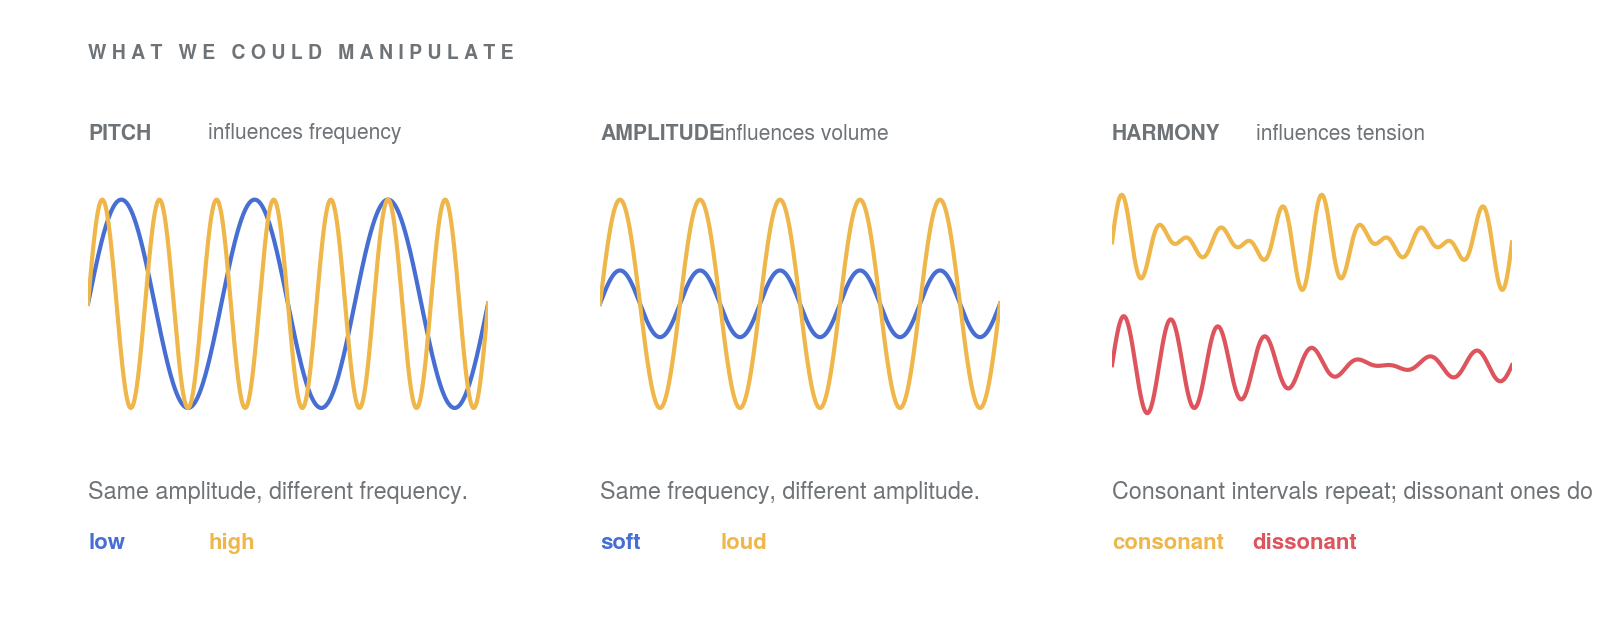
We began with the acoustic properties we could actually manipulate in code including pitch, amplitude, harmony, register, and rhythm, and established how each contributes to emotional character before encoding any of it.
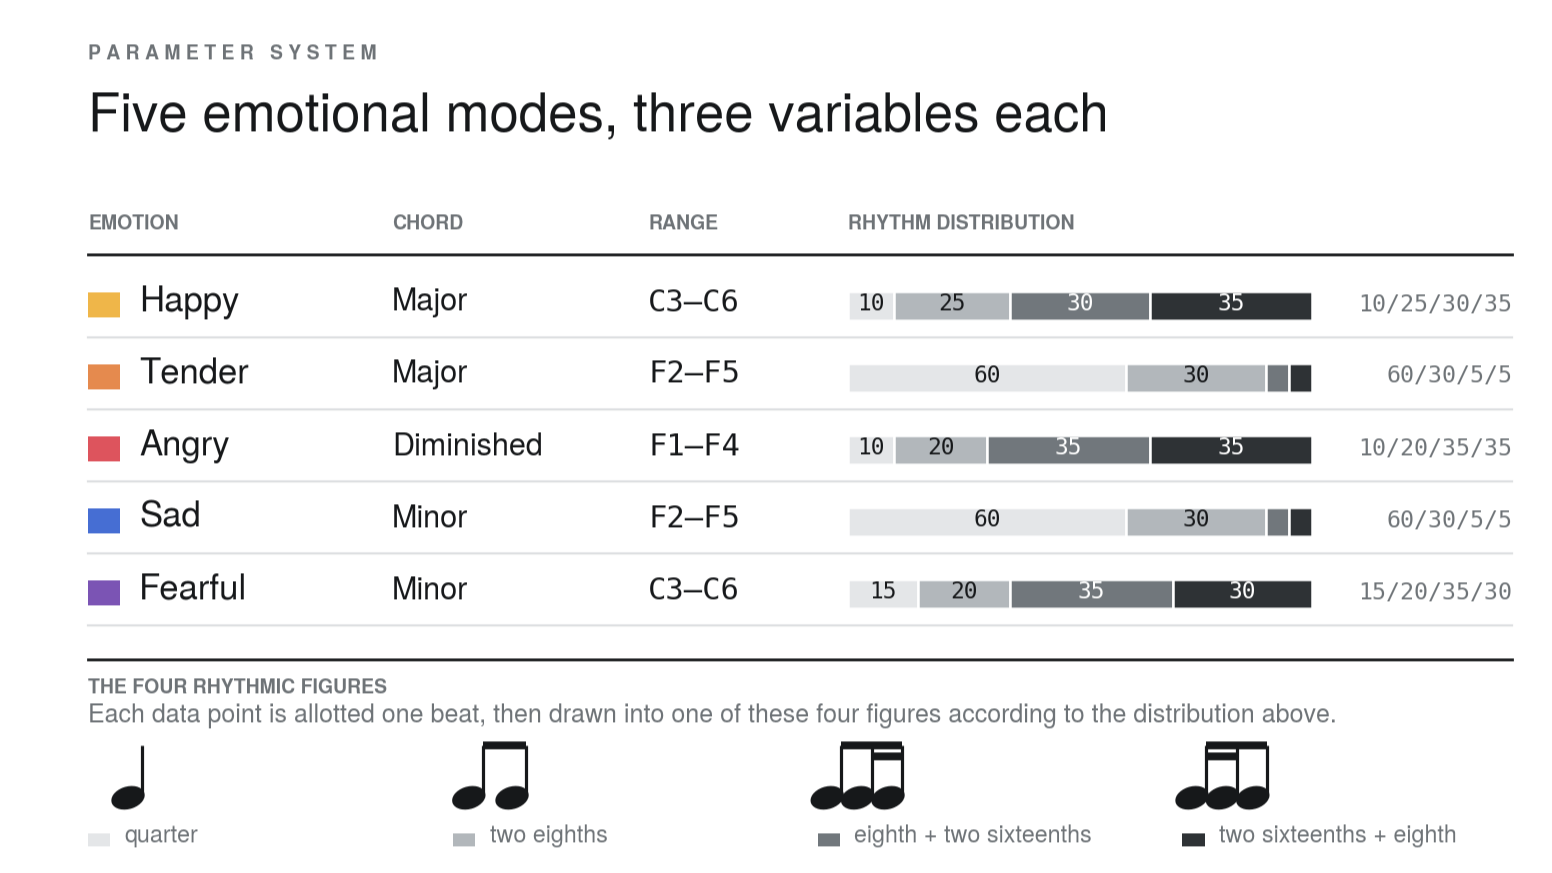
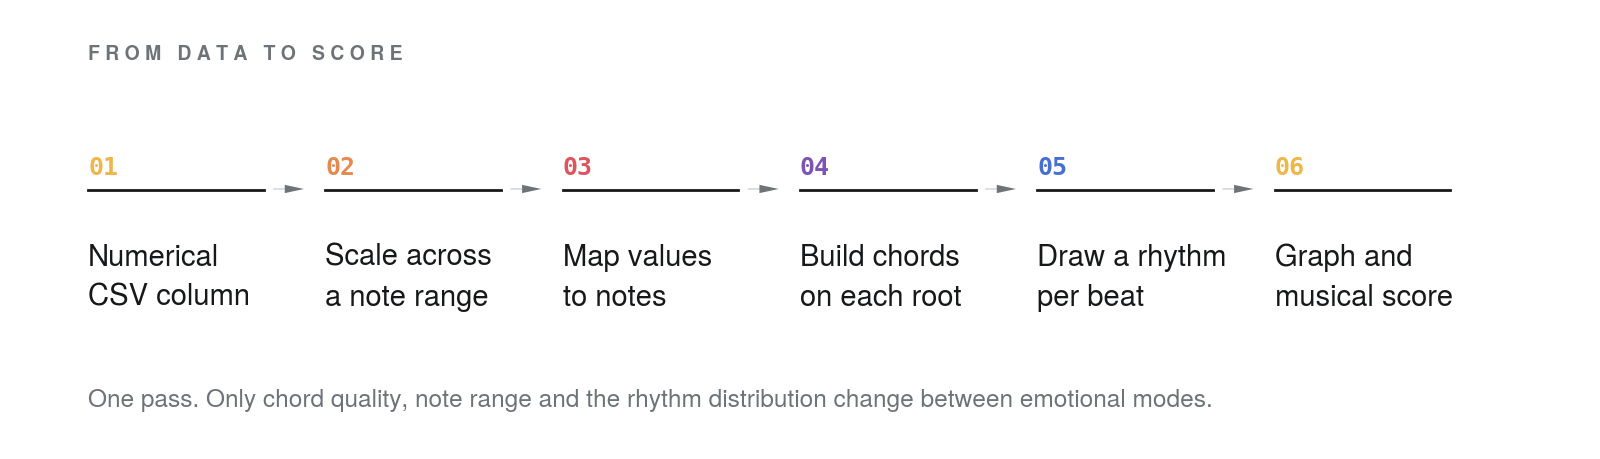
The system reads a CSV directly. It scales the chosen column across a note range, maps each value to a note, builds a chord on that root, allots one beat per data point, and draws a rhythm for that beat from a probability distribution set by the emotion. It outputs both a conventional line graph and a musical score.
Chord quality carries valence, register carries dominance, and the rhythm distribution carries intensity. Those three variables are the whole system.
from data to score
Testing the assumptions
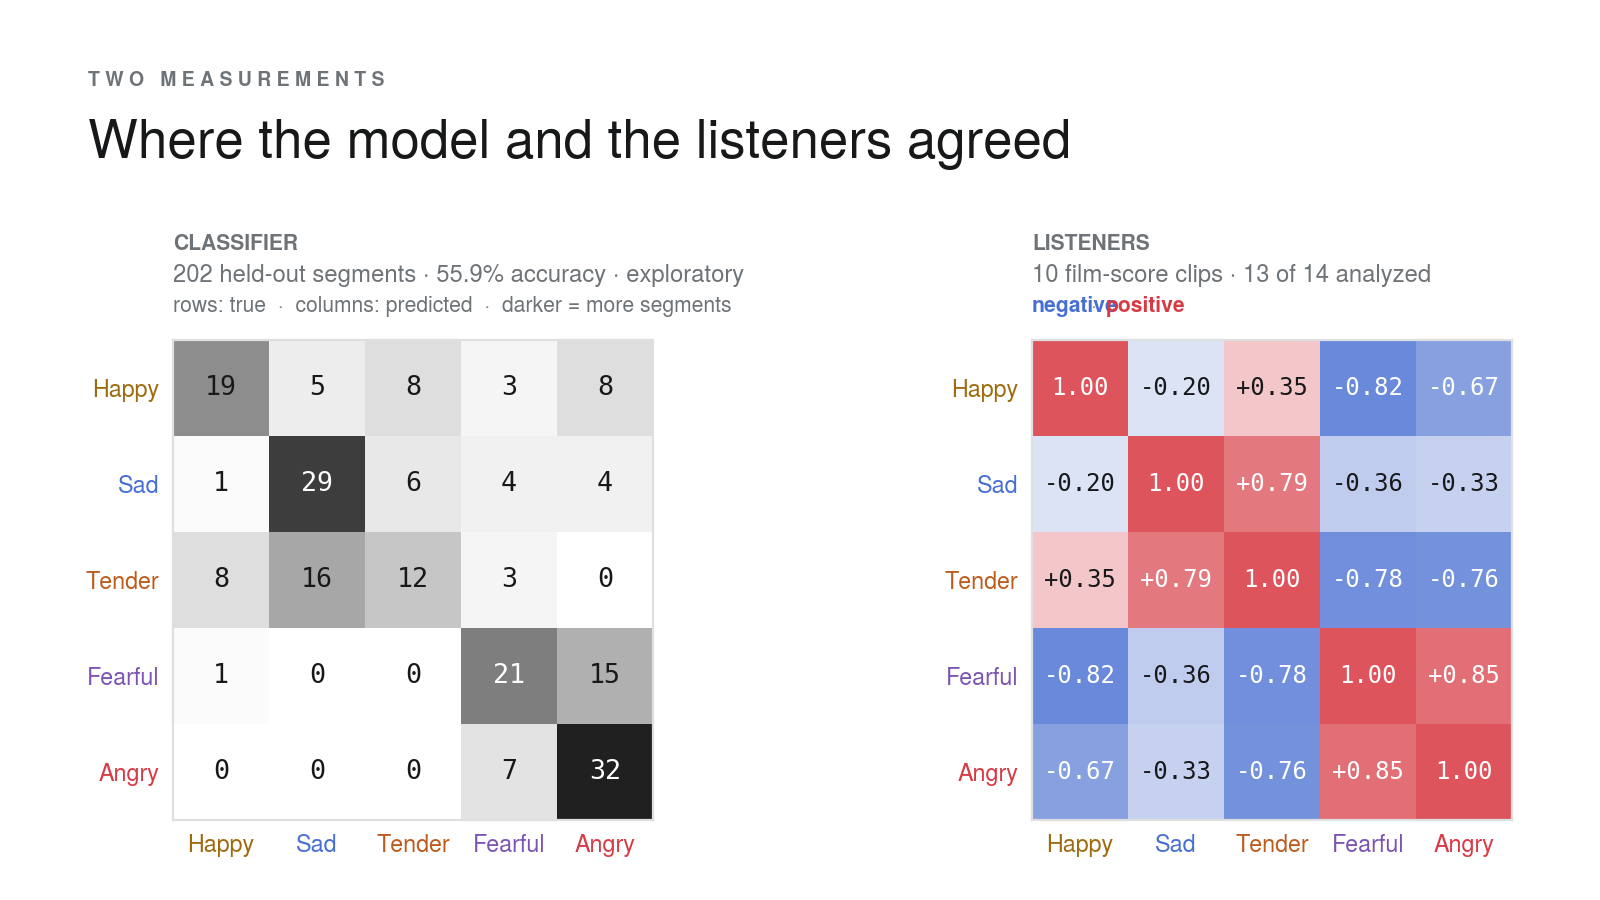
We approached emotional patterns from two directions. An audio classifier trained on labelled film scores reached 55.9% accuracy across 202 held-out segments. Alongside it we ran a listener survey: ten film-score clips, two per emotion, rated on nine-point scales. We received 14 submissions and analyzed 13.
Both pointed the same way. Fear and anger were the model's most frequent mutual confusion and the survey's strongest correlation (r = .85). Sadness and tenderness behaved identically. The five emotions did not resolve into five independent categories.
What we learned
The same series becomes five recognizably different pieces of music through systematic changes to harmony, register, and rhythm, and the framework extends to any numerical column.
The harder lesson was the tension between fidelity and musicality. Data mapping is constrictive by nature, and every choice that made the output more musical put another layer between the listener and the numbers. The classifier made the point for us: fed our finished sonifications, it struggled, having been trained on orchestral scores far richer than anything we produced.
This is a working prototype rather than a finished product, intended for continued development in to an interactive exhibit by the Duane Lab .